Kanal: Unterschied zwischen den Versionen
Admin (Diskussion | Beiträge) |
Admin (Diskussion | Beiträge) |
||
| Zeile 10: | Zeile 10: | ||
* Objekte für die man einen Report erstellen möchtein Tabelle markieren | * Objekte für die man einen Report erstellen möchtein Tabelle markieren | ||
* mit der Maus auf das Report-Icon in der Tabelle klicken, es öffnet sich der Reportdefinitons-Editor. | * mit der Maus auf das Report-Icon in der Tabelle klicken, es öffnet sich der Reportdefinitons-Editor. | ||
==Aufbau des Reportdefinitons-Editors== | ==Aufbau des Reportdefinitons-Editors== | ||
| Zeile 47: | Zeile 48: | ||
==Vorbereiten einer Crystal Report-Datei für die Integration von Kartenausschnitten== | |||
* In der CR-Datei muss ein Bildbereich definiert werden. (Einfügen OLE-Objekt) | * In der CR-Datei muss ein Bildbereich definiert werden. (Einfügen OLE-Objekt) | ||
Version vom 28. August 2013, 11:17 Uhr
| Themenübersicht | Hauptseite • Installation • Administration • GeoMedia Kommunal • Fachanwendungen • Kopplung |
<br\> <br\>
Dieser Bereich beschreibt die einzelnen Funktionen der Fachanwendung Kanal.
Report erstellen
- Objekte für die man einen Report erstellen möchtein Tabelle markieren
- mit der Maus auf das Report-Icon in der Tabelle klicken, es öffnet sich der Reportdefinitons-Editor.
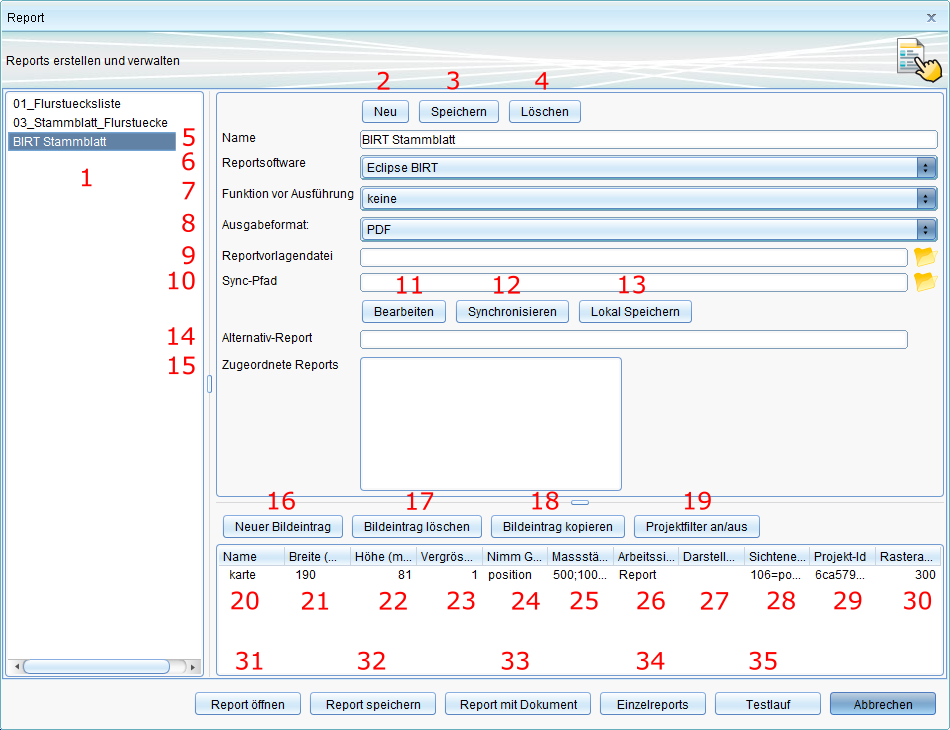
Aufbau des Reportdefinitons-Editors
- Liste der zur Verfügung stehenden Reports
- Name des aktuell ausgewählten Report bzw. Namen-Eingabefeld für einen neu anzulegenden Report
- Eingabefeld für den Pfad zur Crystal Report-Datei (.rpt, CR-Datei) die für einen neu anzulegenden Report verwendet werden soll. Zur Pfadauswahl dient der Button (...) am rechten Ende des Eingabefeldes
- Eingabefeld für den Namen des Alternativreports. Der Name muss der einer bereits angelegten Reportdefinition sein. Diese Funktionalität spielt nur bei der Verwendung von Kartenausschnitten als Bild innerhalb des Reports eine Rolle. Der hier angegebene Report wird dann verwendet, wenn die Massstabsangaben des Hauptreports zu klein für die Erstellung des Kartenausschnittbildes sind. Weiterhin wird dies nur bei der Einzelreporterstellung ausgewertet.
- Eine neue Reportdefinition wird angelegt. Dabei wird der Name und Reportpfad aus den entsprechenden darüber liegenden Eingabefeldern verwendet.
- Die aktuell ausgewählte Reportdefinition wird mit den aktuellen Daten der Eingabefelder gespeichert.
- Die aktuell ausgewählte Reportdefinition wird gelöscht.
- Eingabefeld für den Pfad zur CR-Datei welche in der aktuell ausgewählten Reportdefinition gespeichert werden soll. Mit dem Pfadauswahl-Button kann dabei ein externern vorliegender Report ausgewählt werden.
- Öffnet die CR-Datei der aktuellen Reportdefinition lokal in der dafür vorgesehenen Anwendung. Dabei wird der lokale Pfad zu diesem Report in Feld 8 eingetragen.
- Ersetzt den Report in der aktuellen Reportdefinition mit dem im Feld 8 angegebenen Report.
- Speichert die CR-Datei lokal in einem selbstgewählten Ordner.
- Erstellt einen neuen Bilddefinitionseintrag in der darunter liegenden Bilddefinitionstabelle. Dies wird benötigt um Kartenausschnitte als Bild in den Report einzufügen.
- Löscht den aktuell ausgewählten Bilddefinitionseintrag.
- Name der Bilddefinition. Dies muss sich auf einen entsprechenden Parameter in der CR-Datei beziehen.
- Breite des zu Bildbereichs in der CR-Datei in Millimeter. D.h. das Bild wird mit dieser Breite von Kartenauschnitt erzeugt. Wird hier ein anderer Betrag angegeben als im Bildbereich, wird das Bild von Crystal Reports entsprechend skaliert.
- Höhe des Bildbereichs in der CR-Datei.
- Die Größe des Randbereichs des Bildes in Prozent.
- Liste von Attributen, welche eine Verknüpfung zu anderen Objekten darstellen, von denen die Geometrie als Grundlage für die Erstellung des Kartenausschnittes genommen werden soll. Die Angabe erfolgt dabei in der Punktnotation wie sie im Maskeneditor zur Information verwendet wird. Wird hier nichts angegeben, wird automatisch die nur die Geometrie des selektierten Objektes verwendet. Sobald hier ein Eintrag vorhanden ist, werden nur noch die hier angegebenen verknüpften Objektgeometrien verwendet. Um dann auch das selektierte (Haupt-)Objekt mit einzubeziehen muss die durch die Angabe von „position“ als Attributname geschehen. Als Trenner ist Komma (,) oder Semikolon (;) möglich. Aber immer nur eins von beiden.
- Liste der möglichen Massstäbe. Bei 1:1000 Angabe von 1000. Als Trenner ist Komma (,) oder Semikolon (;) möglich. Aber immer nur eins von beiden.
- Zu verwendete Arbeitssitzung für die Erstellung des Kartenausschnittbildes. Dadurch ist es möglich sich gezielt eine Arbeitssitzung zu definieren, welche den Vorstellungen für den Kartenausschnitt entsprechen und immer wieder verwendet werden kann.
- Liste der Sichtenfilter. Hier kann man genauer definieren, welche Objekte man in den einzelnen Sichten des Kartenausschnittes haben möchte. Die Syntax ist wie folgt Objektklassen-ID = Attributpfad. Die Objektklassen-ID erhält man im Eigenschaftsdialog der jeweiligen Sicht. Der Attributpfad entspricht den verknüpften Objekten ausgehend von dem selektierten Hauptobjekt (wie in Punkt 18 beschrieben). Als Trenner ist Komma (,) oder Semikolon (;) möglich. Aber immer nur eins von beiden.
- Erstellt einen Report und öffnet die fertige PDF-Datei danach automatisch mit der dafür vorgesehenen Anwendung lokal.
- Erstellt einen Report und speichert diesen in einem vom Nutzer definierten Ordner.
- Erstellt einen Report und öffnet die fertige PDF-Datei danach automatisch mit der dafür vorgesehenen Anwendung lokal. Ausserdem wird für jedes selektierte Objekt eine Dokument-Objekt in Polygis angelegt, das die eben erstellten Report enthält und damit dauerhaft in Polygis hinterlegt ist.
- Erstellt für jedes selektierte Objekt eine einzelnen Report und hinterlegt diesen per Dokument-Objekt in Polygis.
- Führt eines Testlauf durch, bei dem kein Report erzeugt wird. Am Ende öffnet sich eine Textdatei mit dem Ergebnis des Testlaufs. Dies ist vor allem sinnvoll um vorher zu überprüfen, ob der angegebene Massstab für den Kartenausschnitt ausreicht.
- Bricht den Reportdialog ab.
Vorbereiten einer Crystal Report-Datei für die Integration von Kartenausschnitten
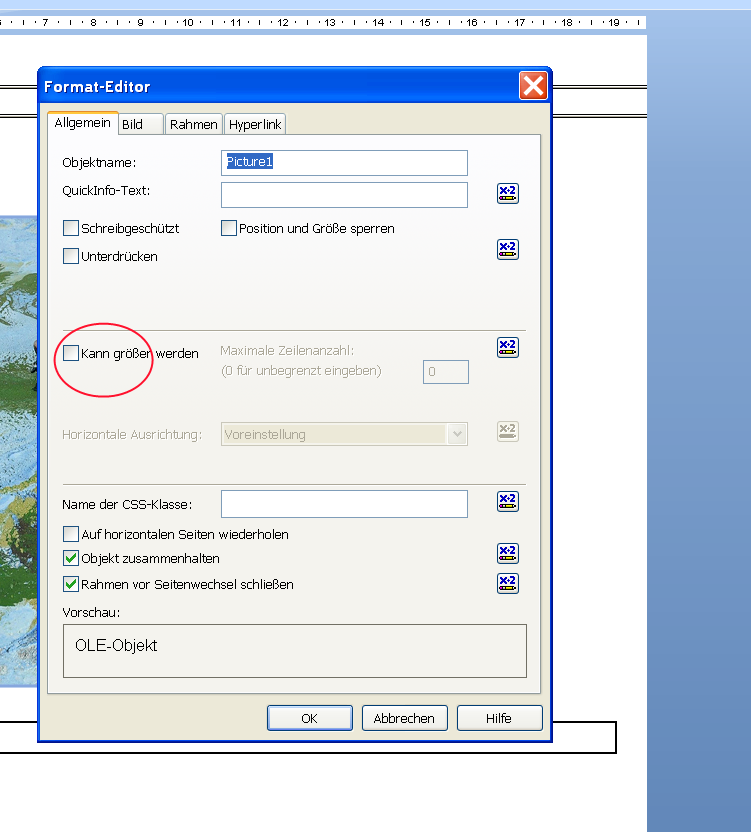
- In der CR-Datei muss ein Bildbereich definiert werden. (Einfügen OLE-Objekt)
- Per rechte Maustaste im Bild den Grafik-Formatieren Dialog aufrufen und den Haken aus „Kann grösser werden entfernen“
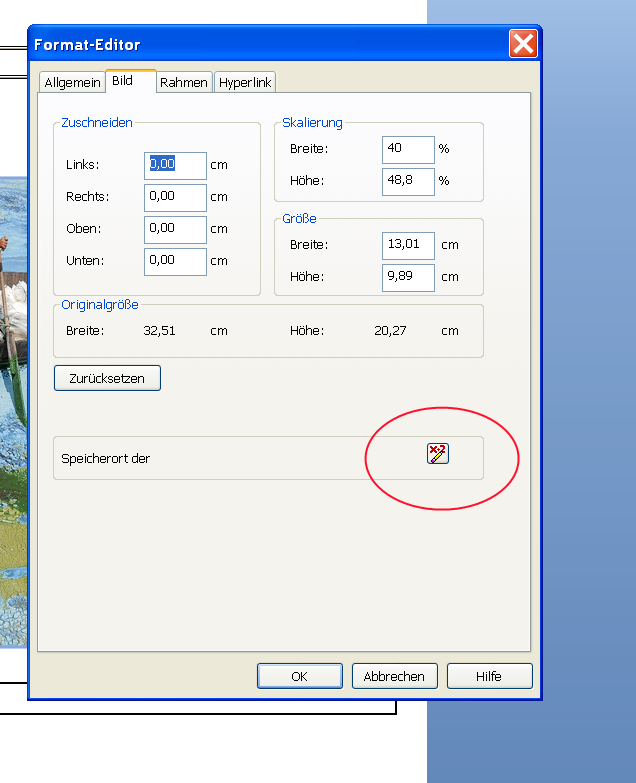
- Im Reiter „Bild“ kann man die Bildgrösse in Millimeter einsehen. Im selben Tab den Button „Speichert der“ betätigen, um einen dynamischen Speicherort anzugeben.
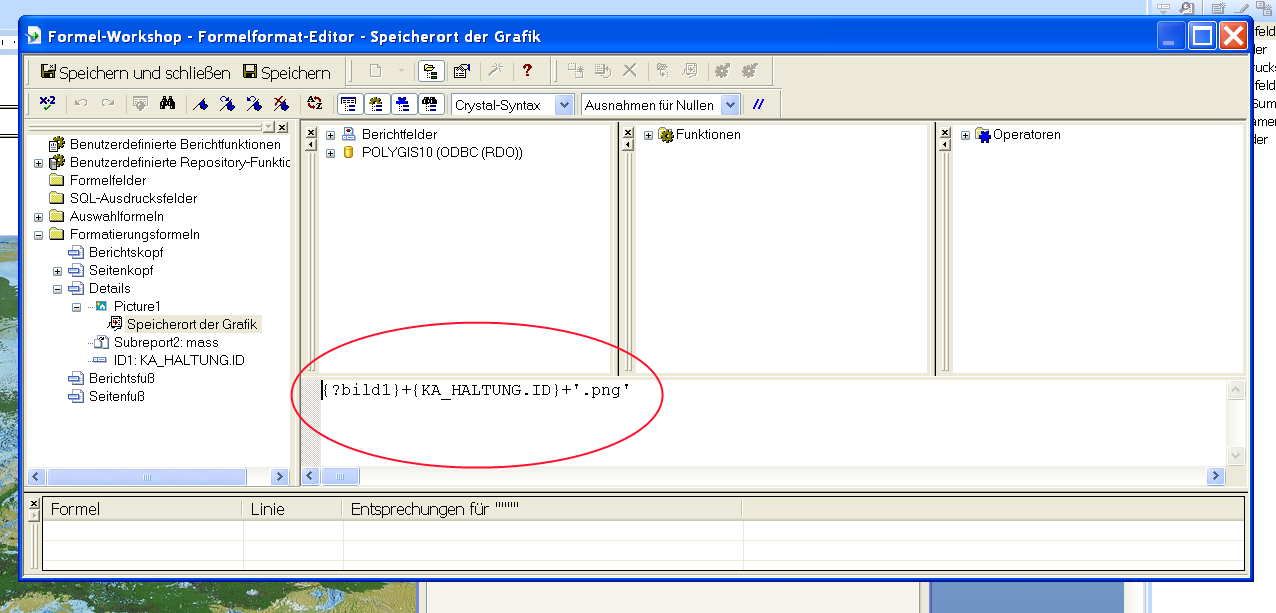
- Im nun geöffneten Formeleditor eingeben, wie sich der Bildpfad zur Laufzeit berechnet:
Dabei wird ein Crystal Report-Parameter verwendet (?bild1) gefolgt von der ID der Objektes welches in diesem Report dargestellt werden soll (KA_Haltung.ID) und die Dateiendung des Bildes (.png). Der Name des Bild-Parameters wird dabei als Name für die Bilddefinition verwendet. Über diesen schreibt Polygis zur Laufzeit einen Teil des Bildpfades in diesen Parameter und Crystal Report vervollständigt diesen mit Hilfe der oben angegebenen Formel.
Select New Project in the quick list section Project to open the dialog box for setting up a new project.
The form contains boxes for entering all necessary project settings (name, project area, coordinate system, and so on). It is divided into four sections, which are explained in the following table.
|
|
| Project Specification | Type in a new project name.
|
| Coordinate System |
Click Add CS to define a new coordinate system. Make sure to have a corresponding CSF file (GeoMedia coordinate system file) available. This list of coordinate systems will be available whenever creating a new project or editing an existing one. It is not necessarily the list of coordinate systems that is available to the client. <br\> Note: If the EPSG code is set, be sure it's the correct one.
Click Datei:Edit cs.png to edit the selected coordinate system. |
| Project Area | Define the minimum bounding rectangle of your project by inserting the maximum extent of your data.
|
Click Save to save your settings.
Click Delete to delete the project.
<br\>
<br\>
![]() To the top
To the top ![]()
Bewertung
There are two ways to get the form for selecting a project:
- Use the quick link section Project and click Projects.
- Navigate to the basic workflow (see following figure) and select the entry Projects.
You will be directed to a list with all projects already entered into the underlying database. By double clicking on a specific project, you will be forwarded to the data sheet with all information to the current project settings and the possibility to edit them.
If the list of projects gets too long, you may use filtering to quickly find the needed project(s). To use filtering, expand the filter by clicking on  in the upper-right corner of the header.
Filter: The filter looks as follows
- Type in the name of the project in the section Name. Note: You will not need a wild-card if you want to search, for example, for projects with specific letters.
- By clicking Apply Filter you execeute the filter. As a result, you will see only the filtered projects in the list.
- Click Reset Filter to cancel the filter.
Additionally, you may sort the projects by name. Click on the list header Name to sort alphabetically. If you want to reset the sorting, you have to click Datei:Reset sorting.png.
<br\>
<br\>
![]() To the top
To the top ![]()
XXXXXXX
All settings previously made for a project may be modified here. The form corresponds to the form where the project was defined.
The form contains boxes for entering all necessary project settings (name, project area, coordinate system, and so on). It is divided into four sections, which are explained in the following table.
|
|
| Project Specification | Type in a new project name.
|
| Coordinate System |
Click Add CS to define a new coordinate system. Make sure to have a corresponding CSF file (GeoMedia coordinate system file) available. This list of coordinate systems will be available whenever creating a new project or editing an existing one. It is not necessarily the list of coordinate systems that is available to the client. <br\> Note: If the EPSG code is set, be sure it's the correct one.
Click Datei:Edit cs.png to edit the selected coordinate system. |
| Project Area | Define the minimum bounding rectangle of your project by inserting the maximum extent of your data.
|
Click Save to save your settings.
Click Delete to delete your settings.
<br\>
<br\>
![]() To the top
To the top ![]()
XXXXX
Themes are similar to topics. They are used to group feature classes according to a logical relationship. Feature classes in GeoMedia Smart Client may only be used by the client if they are assigned to a theme. For example you create a theme named Infrastructure. Then you can for example assign features like streets, churches and so on to this theme. If you start GeoMedia Smart Client you can see the themes you have created in the administrator in your legend and if some features are assigned to the themes you can open the themes and then see all the assigned features.
Click on the tab Legend to define your themes in the legend.
<br\>
<br\>
![]() To the top
To the top ![]()
XXXXX
Add a theme by clicking Add Theme. A popup window will be opened.
Type in your specific theme name and decide if you want to set your theme as Is closed or as Is hidden.
|
Theme options | |
| Is closed | The client will be able to see the entry of the theme in the client's legend but will not be able to see the individual associated feature classes.However, symbology and all functions of the features in the map will not be affected. |
| Is hidden | A theme will not be shown in the legend at all, but the feature classes within that theme are displayed in the map and hold all defined functionality. |
<br\> <br\> Click Save to save the new theme. Click Cancel to return to the previous form.
<br\>
<br\>
![]() To the top
To the top ![]()
Schadensdarstellungen
Die Schadensdarstellung dient dem vereinfachten Filtern von Isybau-Zuständen (z.B. beim Anlegen von Sichten). Jedem Isybau-Zustand kann eine Schadensdarstellung zugewiesen werden.
Erstellen von Schadensdarstellungen
Die Objektklasse für die Schadensdarstellung befindet sich in der Fachanwendung 'EVU_Stammdaten'. Die relevanten Einstellungsmöglichkeiten sind in der Maske dargestellt:
<br\>
<br\>
![]() To the top
To the top ![]()
Zuweisen von Schadensdarstellungen
Ablauf bei der Zuweisung von Schadensdarstellungen
Filtern mit Schadensdarstellungen
Removing Themes or Features
To delete a theme, click on the name of the theme, so the font is covered by a orange buffer and then click on Edit theme. Then a new window opens (the same as the first figure of this section), where you can edit the name or set the theme as closed or hidden. In this window is a button Delete too, which deletes the theme.
To remove a feature class from a theme, check the box in front of the name and click Remove.
<br\>
<br\>
![]() To the top
To the top ![]()
Adjusting themes or features
In the legend panel it is also possible to move feature classes to another theme. At first you have to click the checkbox of the desired feature class, then click on the name of a theme and click Move to.
It is also possible to switch the order of the themes or features. At first you click the checkbox in front of a theme/feature, then click on the name of the theme/feature after which you want to have the theme/feature and at the end you click MoveAfter. With this step the first chosen theme/feature gets located after the second one.
<br\>
<br\>
![]() To the top
To the top ![]()
Legend Configuration (Video)
This video shows how to configure your legend in the GeoMedia Smart Client 2013.
<html>
<iframe width="560" height="315" src="http://www.youtube.com/embed/IMLYy9mshmM?vq=hd1080&rel=0" frameborder="0" allowfullscreen></iframe>
</html>
<br\>
<br\>
![]() To the top
To the top ![]()
Overview map of a project
In GeoMedia Smart Client, up to seven features may define a map overview. The overview provides you with a project view and a rectangle where the actual map view is in relation to the project boundaries. The overview dynamically updates as the display scale changes in the main map window.
The features added to the overview map are displayed in a lower quality in the separate overview window.
To add features to the overview, click on a feature entry on the left, then click on the name of the overview (so the name is covered with an orange buffer) and click Assign.
To remove a feature class from the overview, click on the checkbox in front of the feature class name, then click Remove.
<br\>
<br\>
![]() To the top
To the top ![]()
Projectview
In GeoMedia Smart Client project views can be defined. Project views specify certain settings for a view in the map window. It is only valid for the features it is set for.
<br\>
<br\>
![]() To the top
To the top ![]()
Add Projectview
Use the form on the tab Projectview to define a project view the following way:
- Click Datei:Addprojectview.png to create a new project view in a modal form.
- Enter the necessary information. The following table describes the input fields:
|
|
| Name | Name of the project view. Note: The name must be unique since existing project views cannot be overwritten.
|
| Is restricted | This box will take effect at your printing. If you don't check the box, then you are able to print every visible feature in the project. If you check the box your printing will only contains these features which are assigned to your project view. That means you have three features in your project view and set four features visible in the GeoMedia Smart Client. If the box is restricted is empty, you will able to print all seven features. If you check the box, then only the three features of your project view will be printed. |
| Scale 1: | Scale of the project view the map will be set to |
| Center(East) | X-coordinate of the view's center point |
| Center(North) | Y-coordinate of the view's center point |
- Adding feature classes to the designated project view is the same procedure as before. Select a feature on the left side, click on the projectview on the right side (so the name is covered with an orange buffer), and then click Assign. You can also add whole themes to the project view.
Datei:Projectviewdefined.png
<br\>
<br\>
![]() To the top
To the top ![]()
Edit/Remove Entry
To edit an project view, click on Edit project view. A new window opens, where you can edit your values you've defined before. But there is a new available option:
- Active feature:
With this dropdown list it is possible to set an active feature when you start GeoMedia Smart Client, but it is required that the feature right is set at least to Activate. To set an feature right to Activate, the is locatable checkbox must be checked in the feature options.
To delete a project view, mark it and click Edit project view. Click on Delete to delete it.
| Language: | [[::Kanal|Deutsch]] |
|---|


